Observability Explained: Logs, Metrics, and Traces for Modern Applications
A comprehensive guide to observability covering the three pillars of logs, metrics, and traces, and how to implement an effective observability strategy.
⚡ Key Takeaways
- {'point': 'Logs capture discrete events, metrics track numerical trends, traces follow requests across services', 'detail': 'Each pillar of observability serves a distinct purpose, and correlating them through shared identifiers like trace IDs enables efficient debugging workflows.'} 𝕏
- {'point': 'OpenTelemetry provides vendor-neutral instrumentation', 'detail': 'By adopting OpenTelemetry for logs, metrics, and traces, teams can switch between observability backends without re-instrumenting their applications.'} 𝕏
- {'point': 'Start with service-level objectives to guide instrumentation', 'detail': 'Defining what good looks like for users in terms of availability, latency, and error rates ensures that observability efforts focus on what matters most.'} 𝕏
Worth sharing?
Get the best Developer Tools stories of the week in your inbox — no noise, no spam.
Related Stories
DevOps & Platform Eng
CI/CD Pipeline Best Practices: From Code Commit to Production Deployment
Cloud & Infrastructure
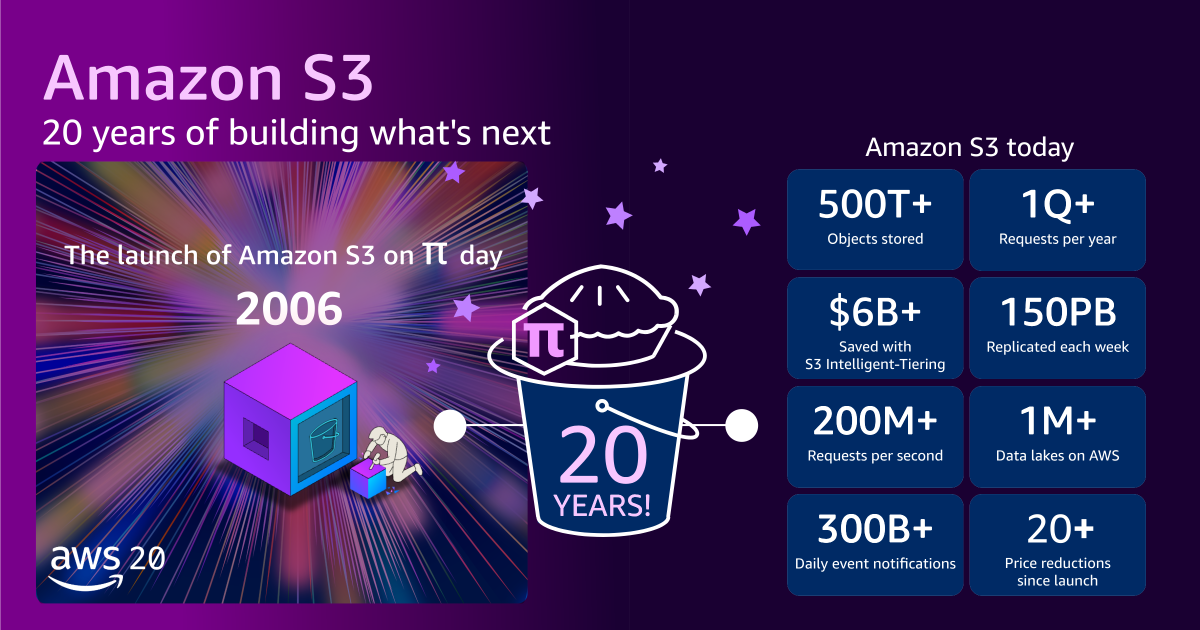
Amazon S3 at 20: Beyond the API, a Foundational Shift
Cloud & Infrastructure
Cloud Monitoring: Don't Let Your Workloads Implode in Silence

DevOps & Platform Eng