It feels like just yesterday we were all marveling at AI’s ability to churn out code with uncanny speed. The expectation? Simpler development, fewer boilerplate headaches. We imagined copilots that just got it, no context switching required. And indeed, tools like Cursor and Claude Code have delivered on that promise, accelerating the coding process at a dizzying pace.
But here’s the thing: writing code is only half the battle. The real magic, the true mastery, comes from understanding how that code behaves in the wild. And that’s where the old workflows start to creak.
This is where the early promises of AI in development hit a stark wall. We were so focused on the creation side of the equation that we forgot about the observation. AI could see our code, sure, but it was utterly blind to the humming, buzzing, often-screaming reality of production. It didn’t know about that rogue latency spike on checkout, or the creeping SLO breach that was silently eroding user trust. It was writing code based on hypotheticals, not actual, breathing systems.
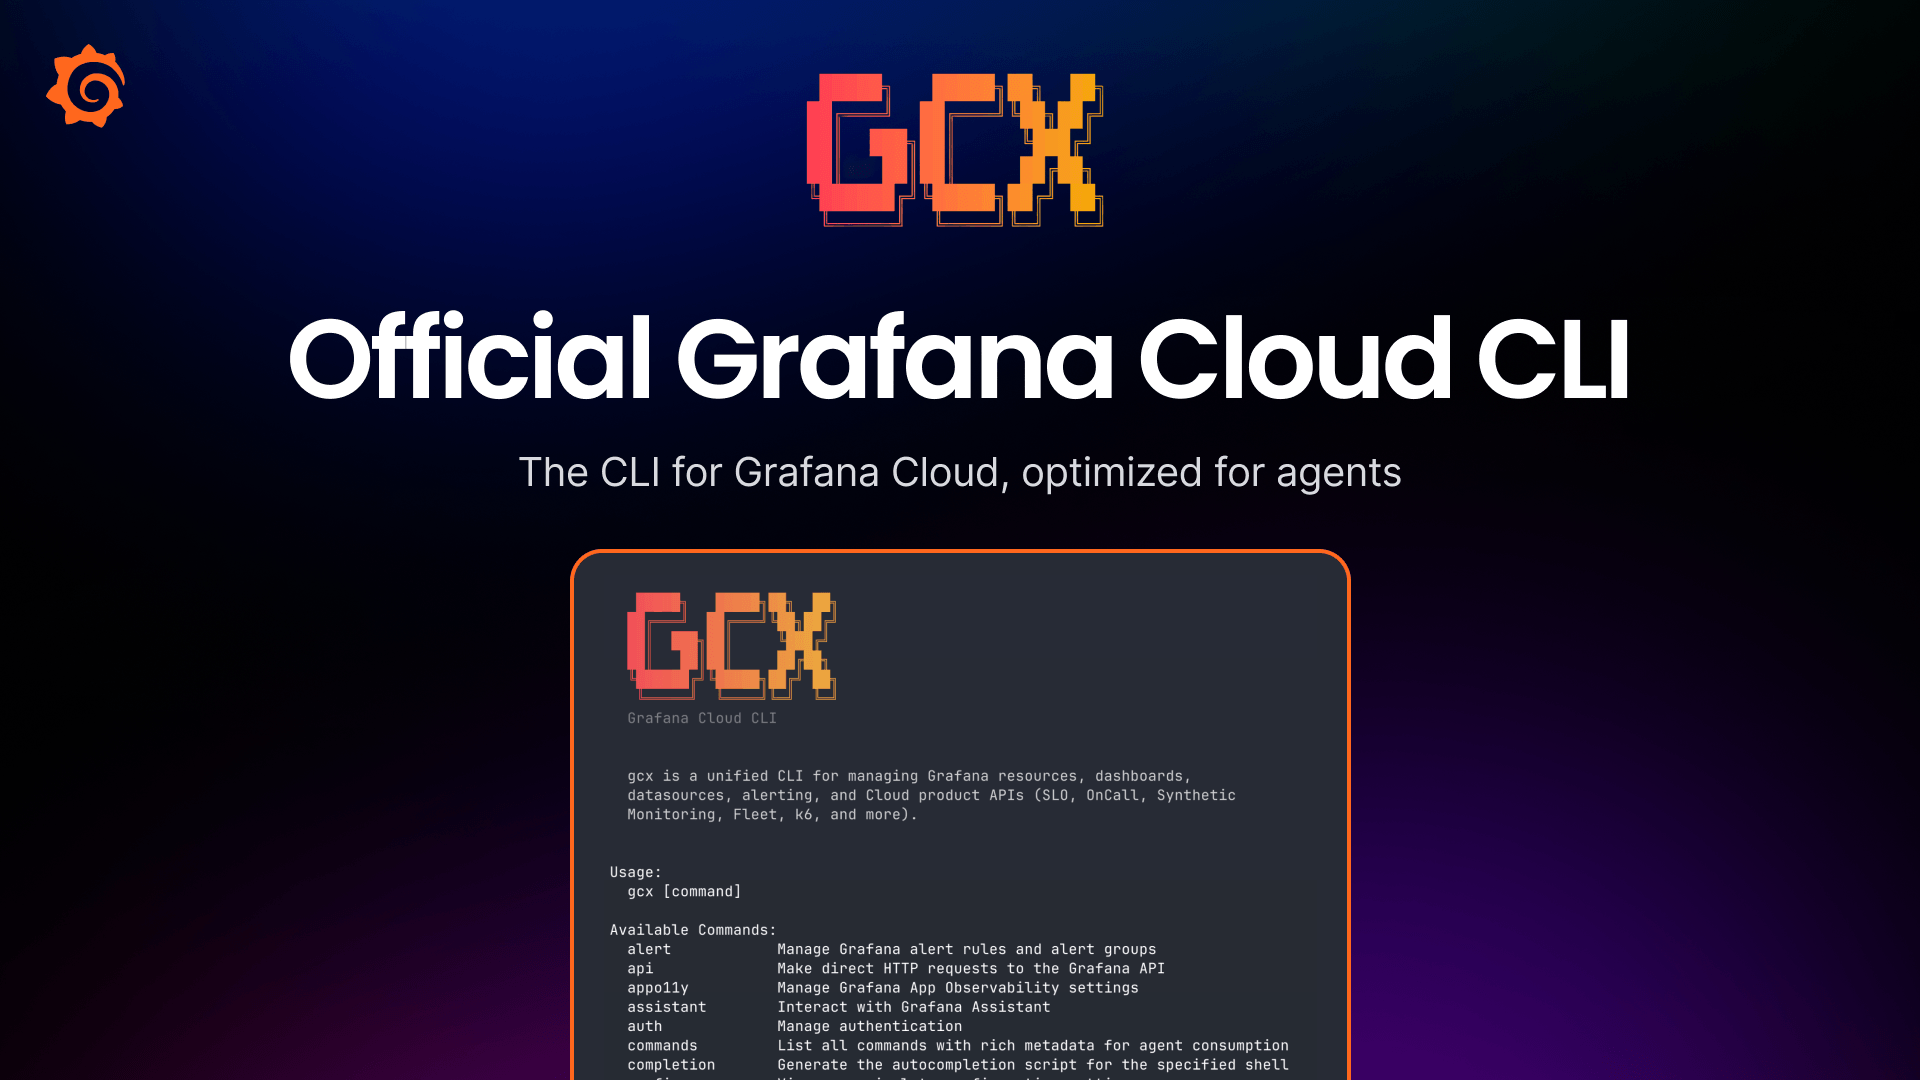
And that, my friends, is why gcx—the new Grafana Cloud CLI—isn’t just another tool. It’s a fundamental platform shift. It’s about bringing the entire observability lifecycle—instrumentation, alerting, SLOs, even frontend and Kubernetes monitoring—directly into the terminal. Where engineers live. Where agents think.
Bringing the Dashboard to the Terminal
Think of it like this: for years, we’ve had these incredible, complex dashboards out on the web, packed with every conceivable metric. Powerful, yes. But they always required that jarring context switch, that mental leap from the IDE to the browser and back. gcx shatters that paradigm. It essentially pulls the most critical parts of Grafana, that essential window into your system’s soul, and squishes it down into a command-line interface. For you, that means spotting and fixing issues in minutes, not hours. For your agents? It means they can finally operate with their eyes wide open.
What does this actually look like in practice? Imagine asking your AI agent: “Why did this endpoint get slower this week?” Instead of just spitting out code suggestions, it can now query traces and latency histograms directly. Or “Is my new query efficient?” The agent can run that PromQL against the actual metrics backend. It’s not guessing anymore; it’s observing.
This isn’t just about convenience; it’s about a complete redefinition of what an AI agent can do. Without this production context, an agent is just a highly sophisticated pattern-matcher, throwing darts in the dark. With gcx, it’s a detective, armed with the crime scene evidence. It can read SLO definitions, understand burn rates, inspect firing alerts, and propose tuned thresholds because it’s seeing what the system is actually doing.
Agents already know how to run
git,kubectl, andgo test. gcx fits in the same slot, and its defaults are tuned for the case where an LLM is the caller.
The Agent-Native Observability Era
This is the real kicker: gcx isn’t just compatible with agents; it’s built for them. The way LLMs reason is inherently CLI-like: text in, text out, stable exit codes. gcx speaks this language fluently. Every command spews machine-readable JSON or YAML. Exit codes are consistent and documented, allowing agents to branch on failure and recover gracefully, rather than trying to parse a cryptic stderr message.
This is the kind of pragmatic engineering that’s often overlooked in the AI hype cycle. We get so caught up in the “what” that we forget the “how.” How do these agents actually integrate? How do they reliably execute tasks? gcx’s focus on stable APIs, consistent output, and machine-readable catalogs means agents can discover capabilities at runtime, rather than relying on potentially stale training data. It’s about building a reliable, composable ecosystem for AI-assisted development.
Consider the cost savings and reliability improvements. CLI-driven agents tend to be cheaper and more dependable than their GUI-bound counterparts. When you strip away the visual fluff and focus on pure function, you get a more efficient and strong system.
This tool is going to fundamentally change how we think about the developer experience in the age of AI. It’s moving us from a world where AI is just a coding assistant to a world where it’s a full-fledged partner, capable of not just writing code, but understanding and managing the systems those code run on. It’s the next logical step in making AI not just a tool, but a genuine platform.
It’s truly an exciting time to be a developer. The terminal is no longer just a command-line interface; it’s becoming the control center for an AI-powered engineering future. And gcx is building the highways for that future.
🧬 Related Insights
- Read more: Blank Debian VM to Python CI/CD Pipeline: Zero to Hero in 60 Minutes
- Read more: Tabularis Brings SQL Notebooks Inside the Database Client — No More Copy-Paste Hell
Frequently Asked Questions
What does gcx actually do? gcx is a command-line interface (CLI) tool that brings Grafana Cloud’s observability capabilities—like metrics, logs, traces, and alerting—directly into your terminal and AI agent workflows.
Will this replace my observability dashboard? Not necessarily. gcx complements traditional dashboards by providing direct access and management of observability primitives from the command line, which is particularly useful for developers and AI agents who spend a lot of time in the terminal.
How does gcx help AI agents? gcx provides AI agents with real-time production context about your systems. This allows agents to make more informed decisions, debug issues effectively, and write code that’s better aligned with the actual state of your running applications, rather than just making assumptions.